Scaling PARAMUS Visualization: Why Advanced Rendering is Critical for Chemists
In cheminformatics and scientific computing, raw data alone is often insufficient for meaningful interpretation. Visualizations bridge this gap, providing immediate insights into molecular structures, reaction mechanisms, spectral data, and analytical trends. PARAMUS integrates an advanced visualization engine that surpasses traditional agents, delivering high-resolution, publication-ready images that enhance scientific workflows.
Why Standard Agents Fall Short
Most AI-based agents focus on text-based outputs, limiting their effectiveness for scientific applications where chemical structures, spectra, and analytical plots are crucial. Standard agents struggle with:
- Lack of domain-specific visualization: General-purpose AI lacks cheminformatics-native rendering for molecules, reactions, and spectra.
- Static, non-interactive outputs: Standard AI agents often generate plain text descriptions rather than interactive, high-quality visuals.
- Inefficient processing of large datasets: Handling time-series data, reaction pathways, and high-resolution spectra requires optimized pipelines.
PARAMUS overcomes these limitations with a multi-layered rendering pipeline designed for chemistry and analytical sciences.
The PARAMUS Visual Pipeline
1. Intelligent Tagging and Data Recognition
PARAMUS automatically detects and tags key scientific data formats, ensuring accurate visualization:
- Molecular structures: SMILES, InChI, and MOL files are identified and rendered into 2D or 3D models.
- Reaction mechanisms: Reaction steps, intermediates, and electron-pushing arrows are visualized dynamically.
- Spectral and time-series data: NMR, IR, MS spectra, and kinetic profiles are plotted with peak annotations.
Tagging ensures automated and precise conversion of raw text into visual elements:
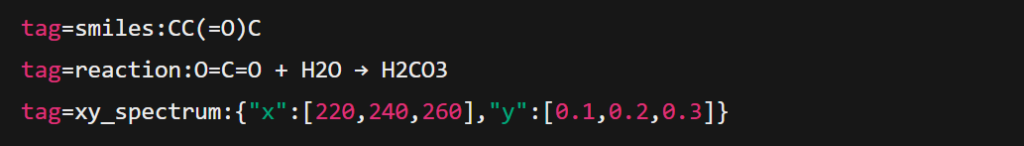
Visual Pipeline TAGS
2. High-Quality Rendering for Scientific Accuracy
Different visual data types are routed through specialized rendering engines:
- Molecules & reactions: RDKit (2D), PyMOL/py3Dmol (3D), and Open Babel for structure conversion.
- Spectra & chromatograms: Matplotlib, nmrglue, and NISTChemPy for high-precision peak plotting.
- Time-series & kinetic data: Pandas with Matplotlib or Plotly for multi-series comparisons.
All visuals are generated at high resolution (300+ DPI) with support for vector (SVG, PDF) and raster (PNG) formats to ensure publication quality.
3. Modular, Scalable Visualization Architecture
PARAMUS employs a modular architecture to enhance scalability and extensibility:
- Plugin-based rendering: New visualization types (e.g., crystallography, heatmaps) can be added without modifying the core.
- Unified rendering interface: Each visual type follows a standardized parse → render → output pipeline.
- Parallel processing & caching: Large datasets are processed asynchronously to avoid slowdowns.
4. Interactive UI for Seamless Integration
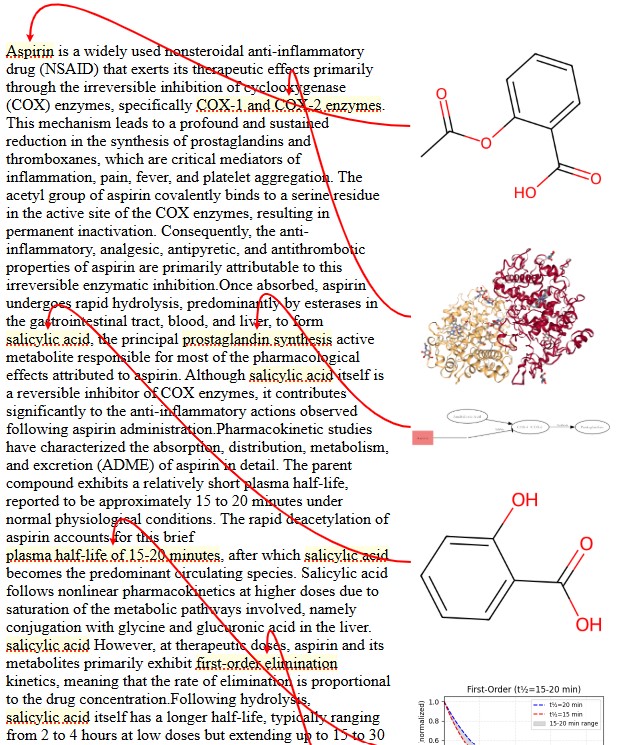
Rendering Examples
Rendered visuals appear inline within the PARAMUS chat interface, with features like:
- Inline preview & expanded view: Clickable molecular structures and reaction schemes.
- Data access links: Allows users to inspect and download raw data.
- Cross-referencing & comparative analysis: Multiple visualizations can be juxtaposed for deeper insights.
Conclusion
Advanced visualization is not just an enhancement—it’s a necessity for modern cheminformatics.
PARAMUS’s rendering engine provides chemists and researchers with the high-quality, domain-specific visualization tools they need, surpassing standard AI agents in accuracy, efficiency, and usability. By integrating a powerful, modular rendering system, PARAMUS ensures that scientific communication is enriched with clear, insightful, and publication-ready visuals.